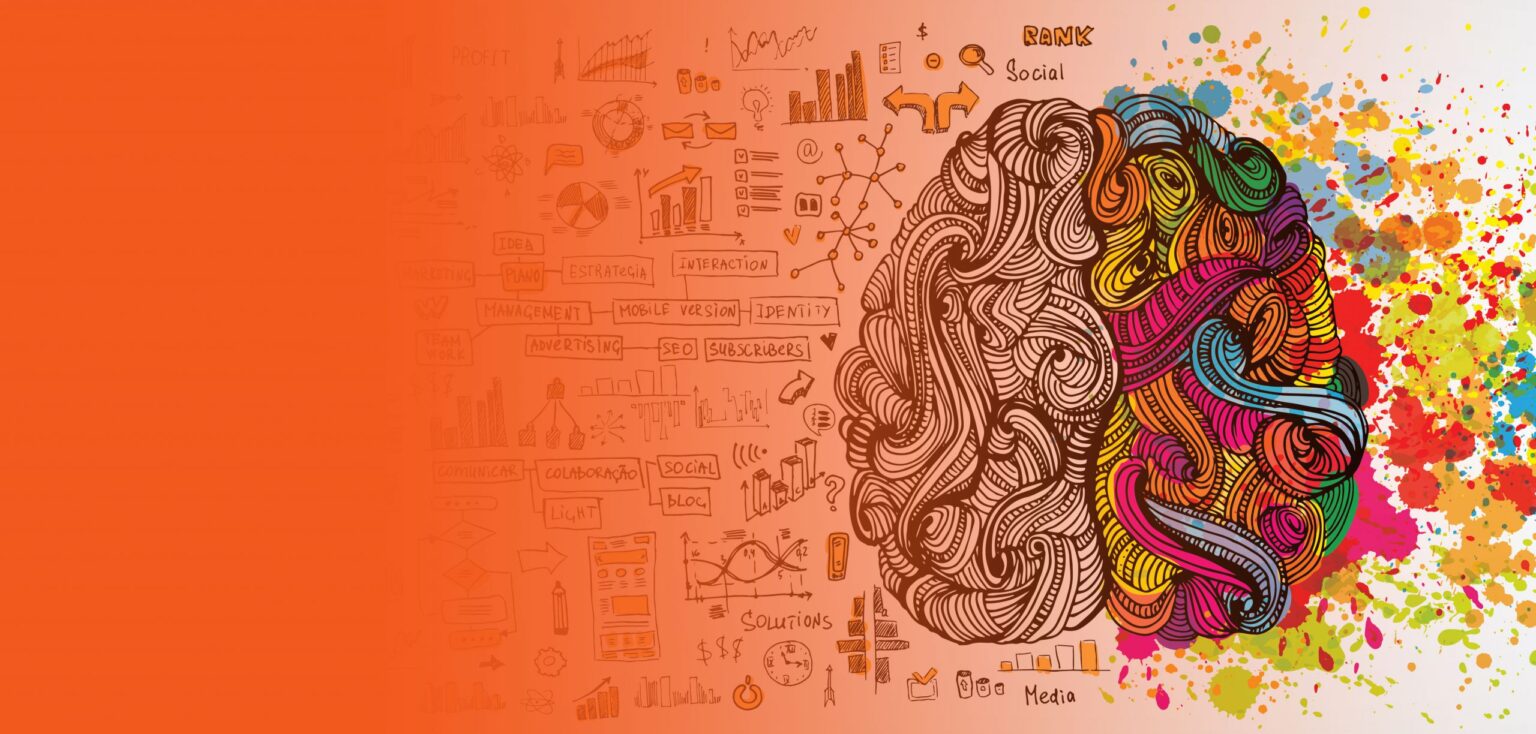
Did you know that 90% of information processed by the brain is visual?
As marketers, it’s our job to create engaging and exciting content to catch the eye of your target market. We live in a world overflowing with black and white text whether it’s on a blog, in an online publication or a post on social media. So how can we ensure that your message is the one that stands out?
The answer lies in creating engaging visual content.
If you’re not yet convinced about the power of infographics and other types of visual content, here are some noteworthy statistics which may make you change your mind.
Infographics help us remember information – When we hear a piece of information, it’s likely that we will only remember 10% of it three days later. However, when you add a relevant image to the same information, we will remember 65% of it. (Brain Rules)They also help us to process it – Our brains filter out around 99% of all sensory information almost immediately. This means that just 1% of information is actually processed by the brain. Infographics are included in this 1%. (QUE Publishing)
Visual information holds our attention – Eye-tracking studies on internet users reveal that we pay close attention to informative imagery. In fact, people spend more time studying relevant images than they do reading text on a page (NN Group)
Plain text is often overlooked – A huge 81% of us only skim-read the content we see online. On average, we only read around 20-28% of text displayed on a page. (NN Group)Higher engagement – Posts on social media which include an image receive 650% more engagement than a post with just text. (Webdam)
Marketers agree! 42% of marketers revealed that graphics were more engaging than any other type of visual content. (Venngage)
Highly shareable – Infographics are one of the most shareable pieces of content out there. When you post an infographic, it is 3 x more likely to be liked and shared online than any other type of content. (NN Group)Visual content is popular with online users – Visual content is widely used by marketing professionals (74% of social media marketers use visuals more than any other type of content, ahead of blogs (68%) and videos (60%). (Social Media Examiner)
They’re great for storytelling – Visual assets such as infographics were reported to be core to how a companies brand story was communicated by 65% of senior marketing executives. (MediaPost)
The data speaks for itself: infographics and engaging visual content should be an essential part of your marketing if you want to capture and hold the attention of your target audience.
We can help!
Don’t just take our word for it! Why not find out the power of infographics for yourself. With over 30 years industry experience, our Macclesfield based marketing agency are here to create engaging content that attracts your target market and drives traffic to your website.
Click here to find out more about the power of infographics, or get in touch with us to chat about your next project!